I would like to start with my tweet from earlier today.
https://twitter.com/DomenButala/status/907204732762120192
Are they? Or is just the cycle long enough so that the people forgot that bonds might also fall and interest rates rise over time?
Let me start with a 230 years long-term chart of interest rates. 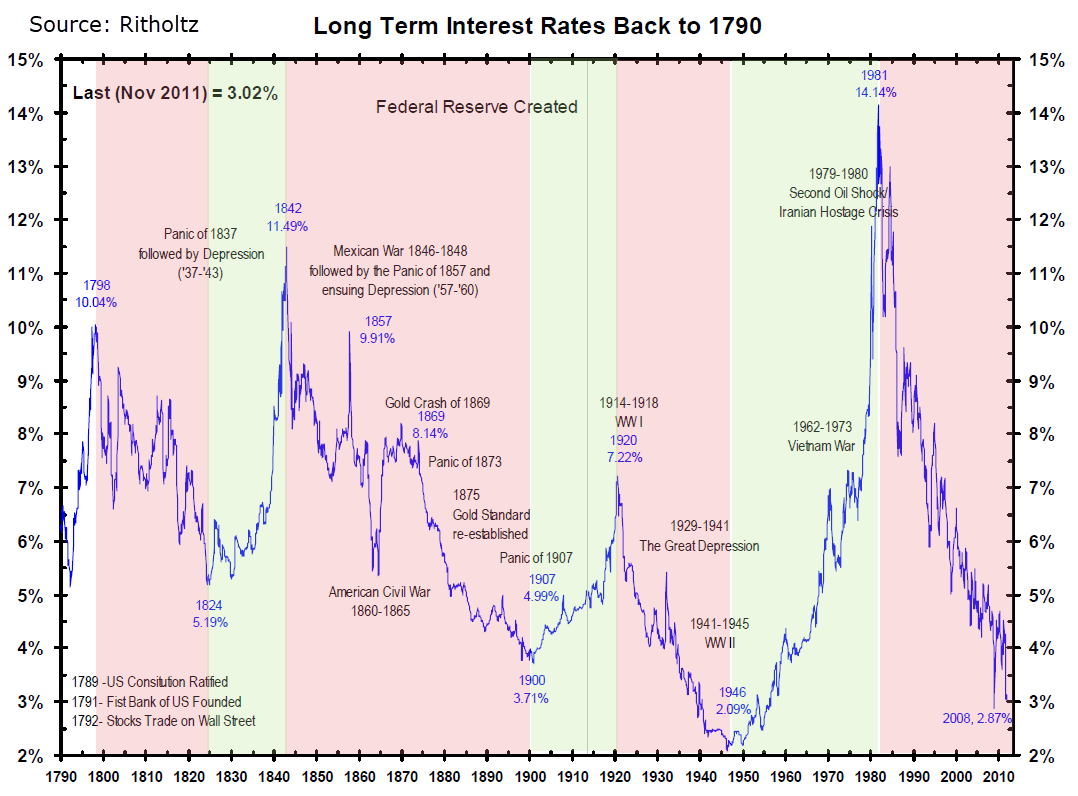
We can see that, indeed, there are cycles where the average length of a cycle is typically around 35-40 years. One can also see that the current cycle started in 1982 or, yes, you guessed it, 35 years ago. Funnily enough rates are also at historic lows…
Let me show you a monthly logarithmic chart of 10-year US T-Note futures with a friendly reminder that when rates rise bonds fall because of the inverse relationship. Because this looks like a lovely up trend, as mentioned above, one tends to over-emphasize the title of the post / the recent history and under emphasize the long term historical perspective.
If rates really are about to turn higher selling bonds looks like a great risk reward trade/investment right now where 127 level in 10y T-Note looks provides a great resistance where the momentum is arguably waning.
On the other hand, the chart could be forming a massive base with an explosive move higher in the following months. Could be, but I don’t think so.
First argument to back this up is basically the first chart above. Second argument is my bullish stance for stocks (please read more here), where bullish bond story just doesn’t fit in and where the chart below very constructively and clearly confirms this. Please see a ratio between the S&P 500 index and TLT Bond ETF. I would expect the ratio to resolve higher meaning stocks to move higher relative to bonds.
The last argument is a long-term chart of gold to high-grade copper ratio or one could take it as an economy indicator as well.  There is a very visible short term relationship between bonds and the ratio (not shown on the chart, but trust me please). When the ratio is falling, bonds are usually falling and vice versa when the ratio is rising. We see that the ratio broke lower through the 10 year-long rising trendline which is suggesting we could see a weakness both in the ratio and bonds.
Using the ratio one could also draw parallels with the economy. When the ratio is falling there is more demand for industrial metals and less demand for precious metals which is suggesting economy is strengthening and vice versa when the ratio is rising.
If you read the post about stocks (link provided above) you are already aware that the US had a 30 year bull market in stocks between 1982 and 2001 while the bear market was in the period between 2001 and 2013. In the first period the gold to copper ratio was generally weakening while in the second period the ratio rose.
So, could we now see the ratio to fall over the next couple of decades with a stronger economy, higher interest rates and bond bear market? I think so.
If you like this post please subscribe to my blog here or follow me on Twitter @DomenButala.


Leave a comment