I can’t help it but I need to write yet another energy post. It’s hard to be bearish energy in general if oil continues to trend higher (see here) and if US natural gas is just breaking out of a major bottom (see here).
But I promise I’ll try to make this post shorter. I’ve already written about the futures market so let me focus on equities now. My main question is, could $XLE energy ETF start outperforming broad based S&P 500 index?
Let me jump straight into it. Here is a weekly chart of XLE Energy sector ETF on top and in the bottom chart a relative performance vs S&P 500 index.
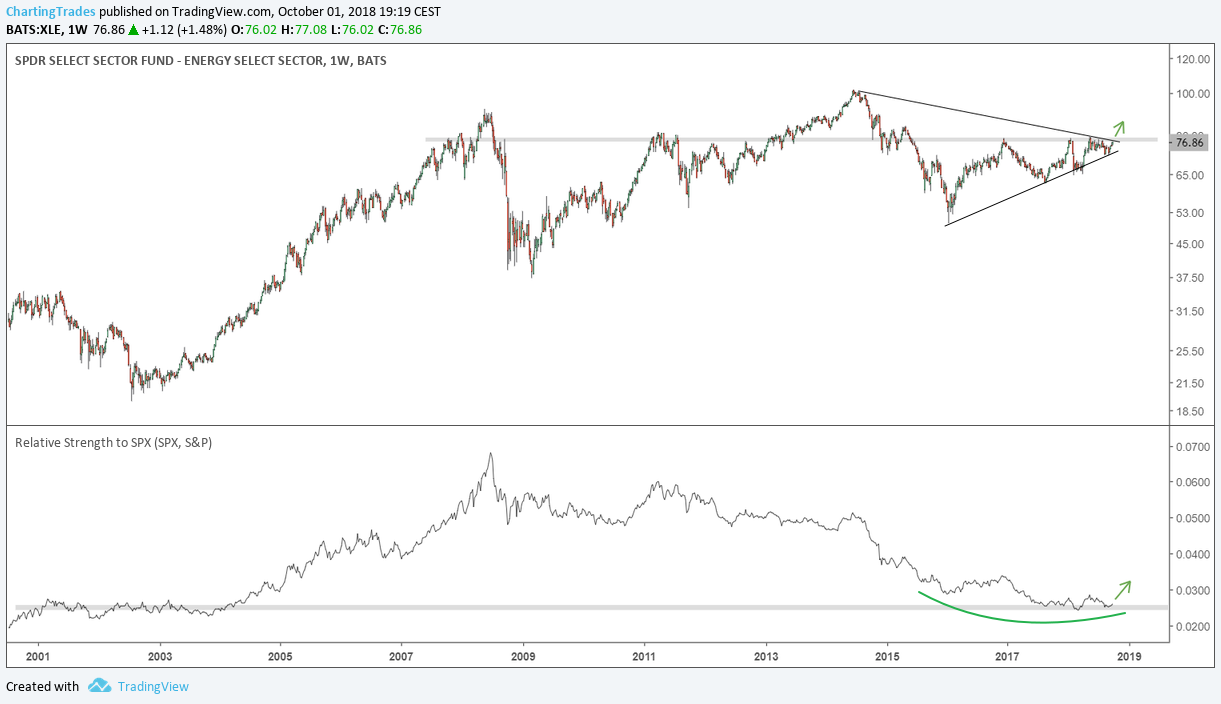
We see that XLE has formed a nice triangle consolidation which is resting just below an important resistance around $78. It has also been consolidating just below it for the past 4 months. And on the bottom chart we see that relative price is trying to bounce from a support that has been formed in the early 2000s.
Let’s take a closer look at the XLE/SPX weekly chart.
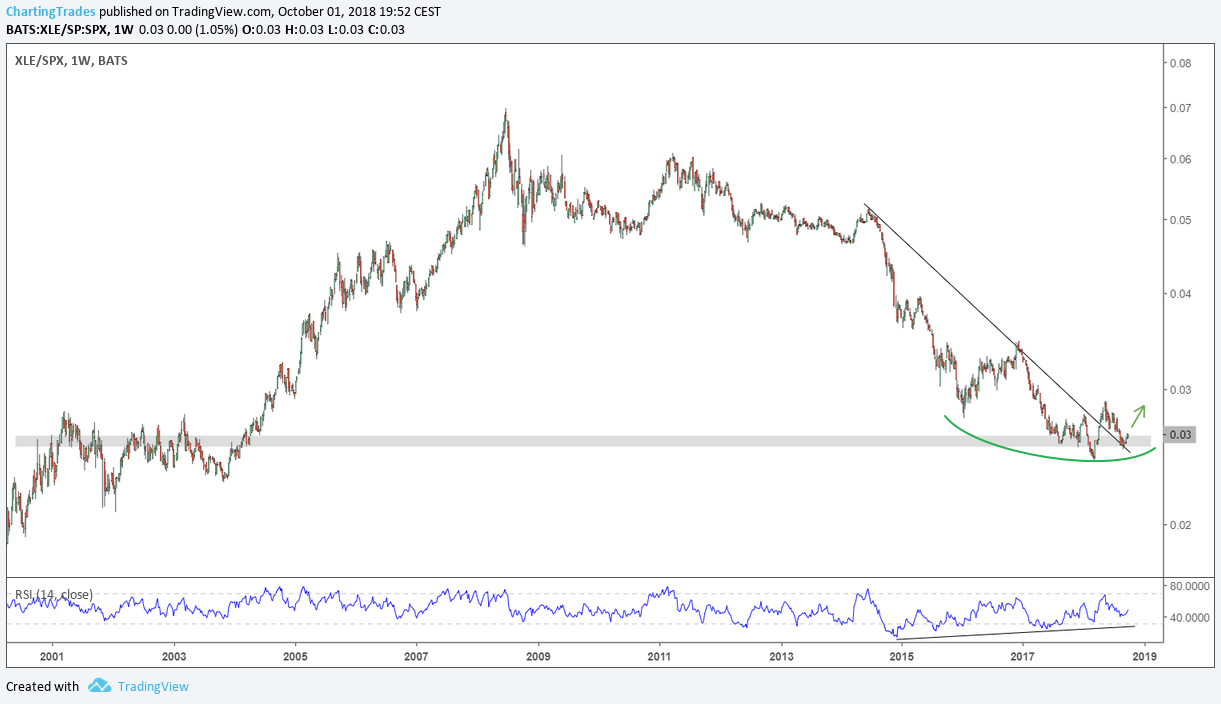
Do you notice that momentum divergence, a first higher high earlier this year that has also made the price to breakout higher through a falling trendline followed by a retest just recently? It looks like it wants to stop trending lower and reverse higher.
I don’t think the broad based S&P 500 index will crash imminently, but the opposite, I think it will continue to be strong. If this is true, if XLE gets above $78-$79 and if relative performance chart starts trending higher, we have a case that energy sector could become a very hot sector in the months to come.


Leave a comment